Markov Chain Modelling of No-Claims Discount Systems
Stochastic Processes
Actuarial Modelling
General Insurance
R
A reproducible R framework for projecting rating-class migration, premium income, and the long-run portfolio mix of a no-claims discount system.
Author
Ntando Sithole
Published
June 20, 2026
Introduction
No-claims discount (NCD) systems adjust a policyholder’s renewal premium according to recent claims experience. A policyholder typically moves toward a higher-discount class after a claim-free year and toward a lower-discount class after one or more claims.
A discrete-time Markov chain provides a transparent framework for modelling these movements. The approach supports several practical actuarial tasks, including:
projecting the future distribution of policyholders across rating classes;
estimating expected premium income over a planning horizon;
assessing the long-run mix of an NCD portfolio; and
testing the financial effect of alternative transition rules or discount scales.
This article develops an illustrative four-class NCD model using reproducible base R code. The assumptions are synthetic and are intended to demonstrate the method rather than represent a calibrated insurance portfolio.
Methodology
Let (X_t) denote the NCD class occupied at the start of policy year (t). The state space is
\[
\mathcal{S} = \{1,2,3,4\},
\]
where Class 1 carries no discount and Class 4 carries the highest discount. Under the first-order Markov assumption,
Each row sums to one. Entry (p_{ij}) is the probability that a policyholder in Class (i) at the start of one year occupies Class (j) at the start of the next year.
If (_0) is the initial row vector of class probabilities, the distribution after (t) transitions is
The matrix reflects progressive movement toward higher-discount classes for policyholders with favourable experience, while retaining a mechanism for movement toward lower-discount classes.
Multi-year transition probabilities
The following function calculates (^n), including (^0=).
matrix_power <-function(P, n) {stopifnot(nrow(P) ==ncol(P),length(n) ==1, n >=0, n ==as.integer(n) ) result <-diag(nrow(P))if (n >0) {for (step inseq_len(n)) { result <- result %*% P } }dimnames(result) <-dimnames(P) result}P_5 <-matrix_power(P, 5)knitr::kable( P_5,digits =4,caption ="Five-year transition probabilities")
Five-year transition probabilities
Class 1
Class 2
Class 3
Class 4
Class 1
0.0354
0.0745
0.1038
0.7863
Class 2
0.0215
0.0352
0.1006
0.8427
Class 3
0.0104
0.0208
0.0647
0.9041
Class 4
0.0050
0.0102
0.0545
0.9303
The first row of (^5) gives the class distribution after five transitions for a policyholder who begins in Class 1.
Stationary distribution
For an ergodic chain, the stationary distribution () satisfies
Under the illustrative assumptions, approximately (92.7%) of the long-run portfolio occupies Class 4. This concentration is driven by the high probability of remaining in Class 4 once it has been reached.
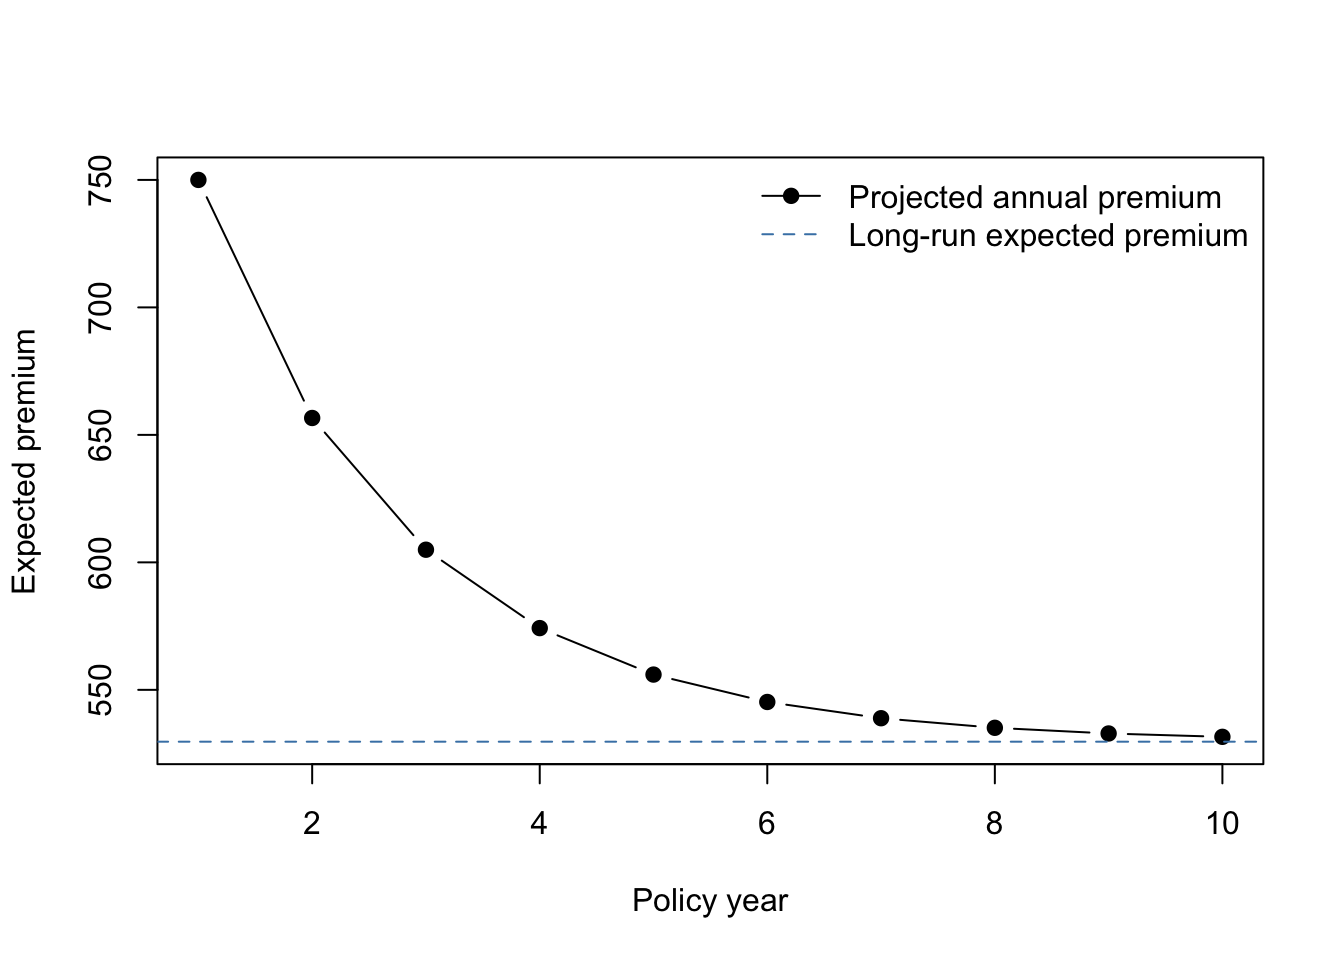
Expected premium projection
Assume a base annual premium of (750) monetary units and class discounts of (0%), (15%), (25%), and (30%).
Ten-year expected premium projection for a Class 1 policyholder
Year
Expected_Annual_Premium
Expected_Cumulative_Premium
1
750.00
750.00
2
656.62
1406.62
3
604.96
2011.58
4
574.22
2585.80
5
555.99
3141.79
6
545.24
3687.03
7
538.87
4225.90
8
535.11
4761.01
9
532.89
5293.90
10
531.57
5825.47
The expected cumulative premium over ten years is approximately (5{,}825.47) monetary units. The annual expected premium declines as probability mass moves toward the higher-discount classes.
This is a portfolio-mix result under the model assumptions; it is not, by itself, a measure of technical profitability.
Actuarial Interpretation
The model separates two commercially important components:
Policyholder migration: The transition matrix captures how claims experience changes future rating classes.
Financial impact: The premium vector converts projected class distributions into expected income.
This separation makes the framework useful for pricing governance and scenario analysis. An actuary can change the transition rules without changing the discount scale, or revise the discount scale while holding policyholder behaviour constant. The financial effect of each design decision can therefore be assessed independently.
The stationary distribution also provides a useful diagnostic. A very high concentration in the maximum-discount class may indicate that the scale is generous relative to claim frequency, that downward movements are too weak, or that the model omits lapse and selection effects. In practice, the result should be compared with observed portfolio distributions and tested under alternative experience assumptions.
Model Limitations
The model is intentionally compact. A production implementation would need to address several limitations:
Markov assumption: Future class movement is assumed to depend only on the current class. Claim history beyond the current state may still contain predictive information.
Time homogeneity: Transition probabilities are assumed constant. Inflation, underwriting actions, economic conditions, and portfolio mix can cause them to vary over time.
Portfolio heterogeneity: A single matrix may conceal material differences by age, vehicle type, territory, distribution channel, or risk segment.
Lapses and new business: The closed-chain model does not include entry, cancellation, non-renewal, or reinstatement.
Premium adequacy: Premium income is projected without claim costs, expenses, commission, reinsurance, tax, or the cost of capital.
Parameter uncertainty: Estimated transition probabilities are subject to sampling error and should be accompanied by sensitivity or simulation analysis.
These limitations do not invalidate the framework. They define the additional features required before it can support pricing, reserving, planning, or capital decisions.
Conclusion
A Markov-chain representation of an NCD system provides a concise link between policyholder claims experience, rating-class migration, and future premium income. The model is transparent, auditable, and straightforward to implement in R.
For practical actuarial use, the next development step would be to estimate transition matrices from portfolio experience, segment the assumptions by material risk characteristics, and integrate projected premium with claims, expenses, lapses, and capital requirements.